BIP latency |
-
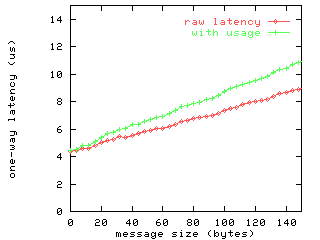
On the figure above, the first curve named "raw latency" represent the raw latency
measured as explained on the previous
page.
The second curve named "real usage" represent the time as measured by taking into account the filling of the buffer passed to bip_send wih some pseudo-random value, and the time to read after the bip_recv each value of the buffer (and checking it is the expected value).
Note also that the precise timings may depend on the position on the stations on the Myrinet switch, and wether you are using SAN Myrinet links, or LAN links. Depending on what pair of stations we are using, we can have transmission time about half a microsecond longer that those on the figures.
BIP bandwidth |
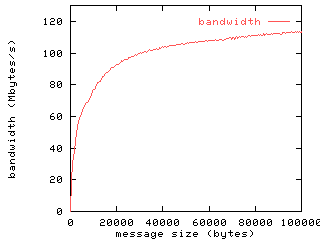
- This figure show the surprising bandwidth sustained by BIP even for medium message size. The same measurement method is again used.
BIP adaptive strategy |
-
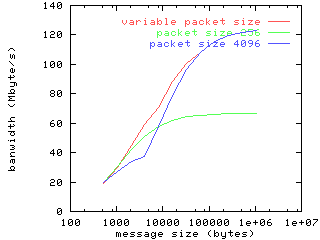
The BIP implementation cut a message into packet starting from a
certain size, the size of the packets use depends heavily on the
message length. The graph below represent the bandwidth obtained with
our implementation with a fixed 256 bytes packet size, a fixed 4096
packet size, or our normal default adaptive strategy.
Clearly there no fixed packet size compromise possible that allow a close to the optimal transmission time, only an adaptive strategy maximize both asymptotic bandwidth and medium message transmission time.
Results table |
-
Here are some numerical results corresponding to the above curves.
Message size (bytes) Elapse Time (one-way) Bandwidth (Mbytes/s) 0 4.30979 0 4 4.70473 0.85021 8 4.75908 1.68100 16 5.00942 3.19398 32 5.66980 5.64394 64 6.43804 9.94091 128 8.37586 15.2820 256 22.7809 11.2375 512 26.3253 19.4490 1024 33.9122 30.1957 2048 45.7438 44.7711 4096 68.9930 59.3684 8192 115.993 70.6248 16384 185.614 88.2692 32768 325.458 100.683 65536 603.300 108.629 131072 1131.45 115.844 262144 2189.34 119.736 524288 4297.29 122.004 1048576 8499.36 123.371 2097152 16830.30 124.605 4194304 33404.30 125.562 8388608 66507.70 126.130
|
|
Last modified: Thu Aug 21 13:44:26 CEST 1997 © BIP team |