Signaux sur graphes et réseaux complexes
Graph signals and complex networks
Graph signal processing and complex networks.
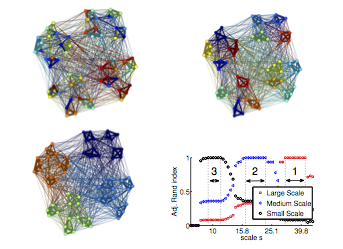
We develop methods and applications of Graph Signal Processing, with a particular focus on also applying these to study complex networks. We have developed new filterbanks for graph signals that are built on connected subgraphs. Also, using spectral graph wavelets we studied communities in networks; that allows us to revisite multi-scale methods to find communities in network. This method is alaso a wavelet-based clustering, and we have shown also how to use it on large networks with wavelet transform of random vectors as features and for unsupervised classification.
Complex network dynamics.
To study dynamical properties of networks, we have proposed new descriptors and a model for the dynamics of mobility networks, before adopting a signal processing approach. Leveraging on the transform of graphs in signals, we propose “time-frequency”-like analyses of dynamic networks. This has been applied to the network of bike sharing systems. Relying on nonnegative matrix factorization, features of temporal networks are exhibited along with the periods they are active, opening a new approach to the study of dynamical networks.
Time-series and graph signals.
For sensor networks, cycles (e.g., daily, yearly) and trends are important. Using nonstationary tools, we show how to compute cycles, residuals and correlations for Live E! data (environmental sensors in Japan) to obtain signals which are then processed on a graph of simularity between data. This can be used to group series together or detect anomalies. We have used also EMD to detect anomalies in sensor network of energy consumption in building.


