


Scientific news - CNRS - Institute of Physics - November 6, 2020.
A team of interdisciplinary researchers has demonstrated that convex optimization is an effective mathematical and numerical tool for a daily estimate of the evolution of the reproductive number for Covid-19, over time and across regions.
Monitoring the spread of the Covid-19 pandemic is one of the major challenges of the global health crisis. The measurement of the evolution of a pandemic is theoretically carried out using epidemiological models that account for interactions in a population between healthy, exposed, sick, cured or deceased individuals. The practical use of these mathematical models, however, involves estimating, based on data from infections, recovery and deaths, a large number of parameters. The health crisis created by the Covid-19 pandemic has meant that collecting epidemiological data of sufficient quality has become difficult. More operational versions of these models have been proposed, focusing on a single key indicator of pandemic evolution: the reproductive number, which accounts for the likely number of future infections induced by each infected person. An interdisciplinary team of signal and information processing specialists, computer scientists, physicists, geographers from the Physics Laboratory (LPENSL, CNRS/Université Claude Bernard Lyon 1/ENS Lyon), the Laboratory of Parallel Computing (LIP, CNRS/INRIA/University Claude Bernard Lyon 1/ENS Lyon) and the Triangle Laboratory (Triangle, CNRS/ENS Lyon/Université Lumière Lyon 2/Université Lumière Lyon 2/Université Jean Monnet/Sciences Po Lyon), have put forward an original approach based on convex optimization, to make a reliable daily estimate of the evolution of the reproductive number over time and across different regions, using data that is far from perfect due to having to work in an emergency context.
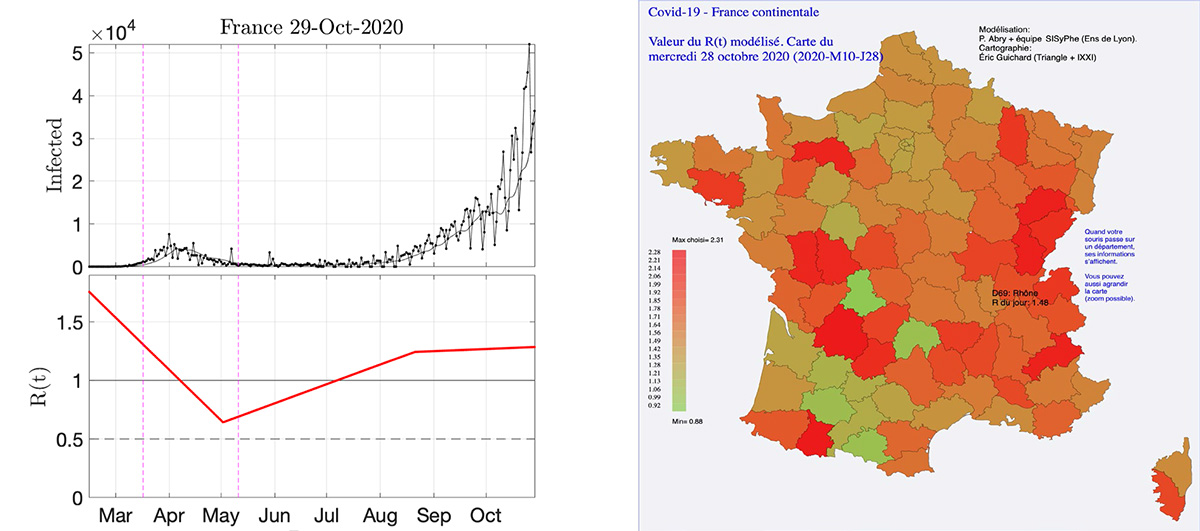
The reproductive number, known as the R value, is defined as the ratio of the number of new infections observed on a given date, to an average of the numbers of new infections observed in previous days, which is weighted by a function that models the period of infection of a person with Covid-19. To estimate this reproductive number, the researchers transformed the mathematical model that links the daily number of new infections with the rate of reproduction into a function, reaching a compromise between respect for the mathematical model and a set of constraints that this epidemiological indicator must, by its nature, respect: it must be positive, evolve slowly over time and vary slightly between neighboring regions. Nevertheless, the function has also been developed to take into account possible disruptions in this evolution, for example due to the impact of health policies. The researchers then developed the algorithm, based on recent numerical techniques and theoretical advances in minimization. The fundamentals of this function provides the most accurate estimate of spatial-temporal evolution of the reproductive number. This tool implemented using data from Santé-Publique-France, the French Public Health organization and the European Center for Disease Prevention and Control, enables us to know, in real time, as well as retroactively, the intensity of the epidemic, and to measure the impact of the various measures taken to respond to the epidemic. Finally, it provides a means of detecting a trend in the evolution of the reproductive number. It is now possible to estimate when it will be less than 1, and therefore, to know when the number of new infections will reach a peak, and then adding about ten days, when the peak of hospitalizations, etc., are likely to be in all regions of France and in more than two hundred countries.
Bibliography
Spatial and temporal regularization to estimate COVID-19 reproduction number
R(t): Promoting piecewise smoothness via convex optimization
Patrice Abry, Nelly Pustelnik, Stéphane Roux, Pablo Jensen, Patrick Flandrin, Rémi Gribonval, Charles-Gérard Lucas, Éric Guichard, Pierre Borgnat, Nicolas Garnier, PLoS ONE, 20 August 2020
DOI : 10.1371/journal.pone.0237901